

An MS Polygenic Score Against Blood Metabolites

A polygenic risk score and a blood metabolite panel are both single numbers attached to one person, and they differ mainly in when they can be read. The genetic score is fixed at conception and available decades before any symptom. The metabolite panel reports whatever the body was doing on the morning of the draw. Three 2026 studies in multiple sclerosis (MS) put the two kinds of number against the same kinds of outcome: who develops the disease, who worsens, and how much brain volume goes. In the first, the genetic score sits in the model throughout and moves no estimate anywhere it is tested. In the other two no genotype is measured at all, and the blood panels do add something, although how much depends sharply on which outcome is being asked about.
A Score That Moves No Estimate
Cai and colleagues followed 377,487 UK Biobank participants aged 40 to 69 for a median of 13.8 years, during which 432 developed MS, at 10.8 per 100,000 person-years in women against 5.8 in men. Their exposure was an aggregated inflammation score built from four routine blood measures: C-reactive protein, white blood cell count, platelet count and the neutrophil-to-lymphocyte ratio. A high score came with a hazard ratio of 1.38 (95% CI 1.10 to 1.72) for incident MS after full adjustment. Taken one at a time, the ratio held for the neutrophil-to-lymphocyte ratio (1.42), white cell count (1.41) and platelet count (1.37), while C-reactive protein on its own fell to 1.09 (0.87 to 1.36) and lost significance. The subgroup analysis carried polygenic risk score category alongside sex, sleep pattern and physical activity, and none of those four modified the association, with every interaction p above 0.05.
The Modifiers That Did Work
What did modify the effect was clinical and social. Among participants with hypertension the hazard ratio reached 2.67 (1.63 to 4.35) against 1.12 in those without, interaction p = 0.002, and C-reactive protein was associated with MS only in the hypertensive group (1.83 against 0.89, interaction p = 0.005). The same pattern held for C-reactive protein in diabetes, 1.81 against 0.90, interaction p = 0.010. Socioeconomic deprivation split the cohort as well, with a hazard ratio of 1.73 in the more deprived half against 1.07 in the less deprived, interaction p = 0.035, and white cell count behaved the same way. Age mattered only for platelet count. The measurements that changed the size of the inflammation effect were therefore a blood pressure reading, a diabetes diagnosis and a deprivation index, none of them genetic.
The Same Score Against Brain Volume
The second half of the study moved to imaging in participants without MS. Higher inflammation went with smaller volumes in all six regions chosen in advance from the MS literature: thalamus (β −0.057), superior temporal gyrus (−0.053), lateral orbitofrontal cortex (−0.050), putamen (−0.047), caudate nucleus (−0.041) and supramarginal gyrus (−0.036). Cortical area fell in three of them and cortical thickness in one. The associations ran consistently stronger in men than in women, reaching interaction significance for four regions. Split by genetic risk, the effects turned up in the low, moderate and high strata alike, somewhat larger in the high one, and once again no interaction between inflammation and genetic risk reached significance for any brain measure.
Five Hundred Metabolites at the First Episode
Peng and colleagues worked at the other end of the disease. Among 451 participants in the BENEFIT trial, all sampled at a first clinical episode and followed for five years under early or delayed interferon beta-1b, 545 serum metabolites were measured by four complementary mass spectrometry methods. Tested one metabolite at a time against seven outcomes, almost nothing survived correction for multiple testing. The exception was the number of relapses, where 42 metabolites went with fewer relapses, among them alpha-linolenic acid, docosapentaenoic acid, oleic acid and several unsaturated triglycerides, and eight with more, including saturated triglycerides and O-methyladenosine. For new lesions, lesion volumes, brain volume loss, disability score and the functional composite, no single metabolite held up. A discriminant analysis using all 545 at once separated nobody except on brain volume loss, at p = 0.02.
Where the Prediction Improved
The picture changed once metabolites were allowed to work as a set. Elastic net models selected features per outcome, and the ten highest-ranked were added to models already carrying age, sex, treatment arm, steroid use at onset, baseline lesion count and body mass index. Prediction of brain volume loss rose from 0.68 to 0.86 by area under the curve, disability score from 0.56 to 0.70, T1 lesion volume from 0.67 to 0.73, relapses from 0.61 to 0.68 and the functional composite from 0.48 to 0.63. Three outcomes gained nothing: the models selected no metabolic features at all for new active lesions or for the composite of no disease activity, and T2 lesion volume fell from 0.59 to 0.52. Among the highest-ranked features were ibuprofen, salicylurate and cotinine N-oxide, which report drug and tobacco exposure rather than endogenous metabolism, and the authors note the directions were inconsistent. Pathway analysis returned nicotinate and nicotinamide, histidine and arginine metabolism across several outcomes.
Thirty-Seven People and Two Proteins
Kacerova and colleagues took the smallest sample and the longest follow-up: 18 patients with at least one event of progression independent of relapse activity and 19 with none, from the Swiss MS Cohort, matched on baseline disability and age. Nuclear magnetic resonance metabolomics told relapsing-remitting from secondary progressive samples at 74.6% accuracy, with glutamine (p = 0.0002), alanine and valine raised in the progressive group. Against future progression the same metabolites were individually weak, glutamine reaching 0.68 and alanine 0.67, and lipoproteins alone were the only predictor of the transition to secondary progressive disease (p = 0.045). Five together reached 0.81 and sorted 14 of 18 progressors and 12 of 19 non-progressors correctly. Serum glial fibrillary acidic protein alone gave 0.72 and neurofilament light 0.68; adding the five metabolites to them gave 0.87 and 0.91. An independent Oxford cohort of 19 progressors and 24 non-progressors, also chosen for extreme walking trajectories, repeated the lipoprotein, glucose and glutamine results but not neurofilament light. The authors name the sample size as their main limitation. Across all three studies, the one number available from birth is also the only one that did not change an estimate.
Disclaimer: This blog post is based on the cited studies and is intended for informational purposes only. It is not intended to provide medical advice. Please consult with a healthcare professional for any health concerns.
References:
Cai, Y., Bao, Y., Li, Y., et al., Cheng, Y., & He, D. (2026). Chronic low-grade inflammation, genetic susceptibility, and the risk of multiple sclerosis: a prospective cohort study. Frontiers in Immunology, 17, 1805464. https://doi.org/10.3389/fimmu.2026.1805464
Peng, X., Bjornevik, K., Clish, C. B., et al., Ascherio, A., & Cortese, M. (2026). Serum metabolic profile at clinical onset as predictor of multiple sclerosis activity and progression after 5 years. Multiple Sclerosis Journal, 32(7), 696-710. https://doi.org/10.1177/13524585261435409
Kacerova, T., Willemse, E., et al., Anthony, D. C., & Probert, F. (2026). Serum GFAP and NfL augment a metabolomics-driven strategy for long-term prediction of multiple sclerosis progression. Communications Medicine, 6(1), 182. https://doi.org/10.1038/s43856-026-01453-5
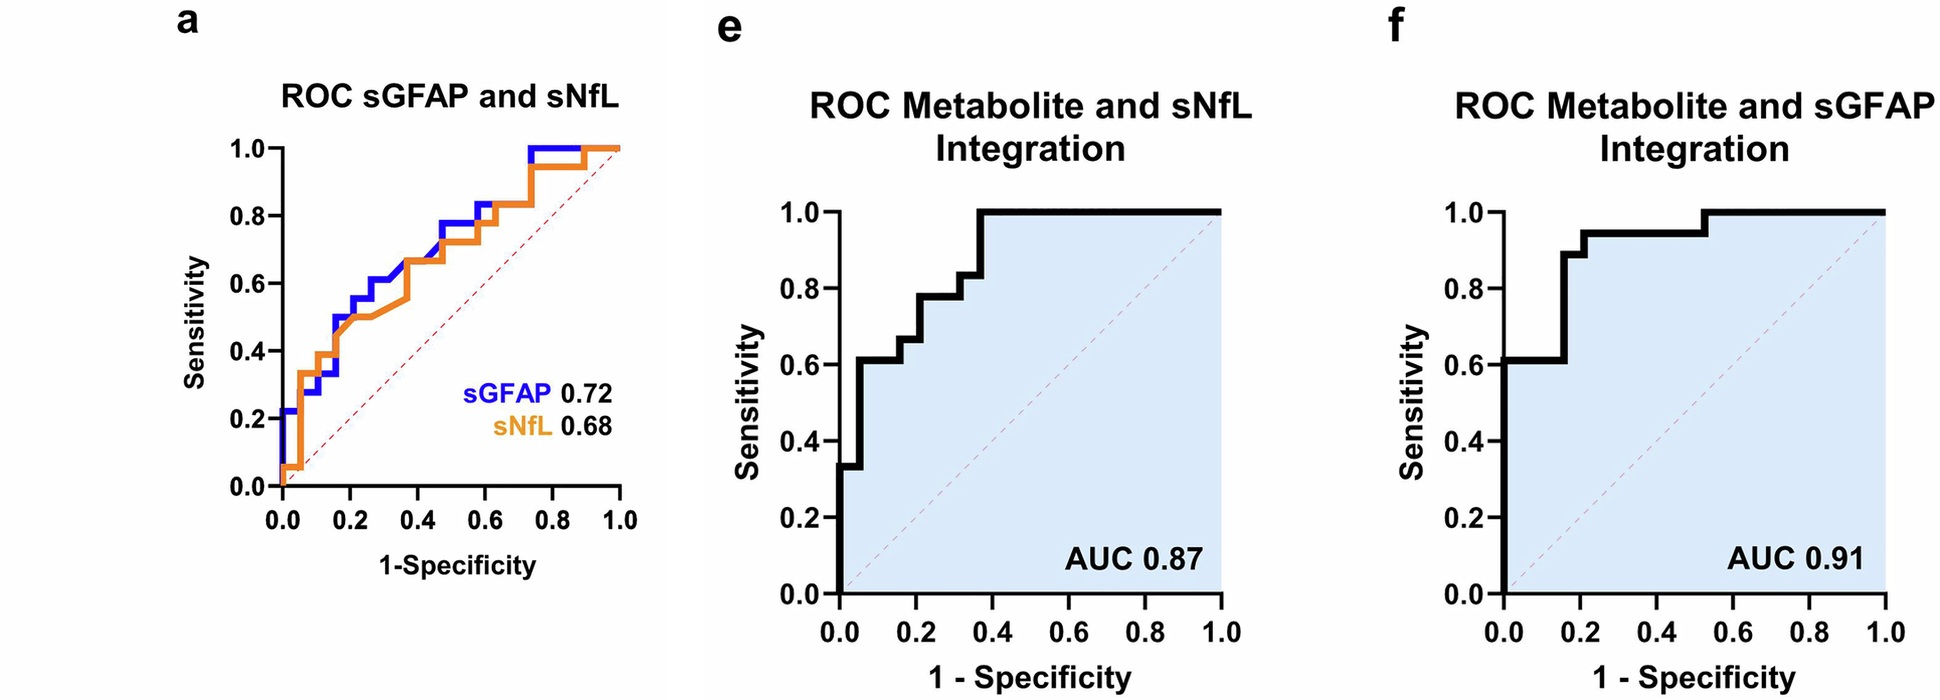
Two proteins alone, then the same two proteins with five metabolites added. The same 18 progressors and 19 non-progressors, sorted on baseline serum alone. (Kacerova, et. al. (2026), Communications Medicine 6(1), 182, Figure 4a, 4e and 4f, CC BY 4.0)