

Three MS Studies on Plasma Proteins, Glucose and Red Cells

Three studies of multiple sclerosis (MS) published this year each read the disease out of blood or spinal fluid, and in each the result sits on one side of a line running through the sample. One uses genotypes to predict the circulating level of two and a half thousand proteins, then looks for them in blood drawn years before anyone was diagnosed. One measures glucose in the spinal fluid and in the serum of the same patients on the same morning. One counts red blood cells in half a million people, then takes the cells apart. Each study names the half of the sample that carries the finding and the half that does not.
Two Thousand Proteins Read From Genotype
Ding and colleagues started from protein quantitative trait loci, the variants that set how much of a protein circulates. They drew them from the three largest proteomic cohorts available: 34,557 participants of European ancestry in the UK Biobank on an antibody platform, and 35,559 Icelanders at deCODE genetics and 10,708 participants of the Fenland study on an aptamer platform. Only variants within or beside the coding gene were kept, since those are more likely to act through the protein itself. That left 2,545 proteins that could be matched to an MS risk study of 14,802 cases and 26,703 controls, with the major histocompatibility complex excluded. Each protein was tested for a causal effect on MS risk, and 58 survived correction for multiple testing. Colocalisation, which asks whether the protein and the disease are driven at a locus by one shared variant rather than two neighbouring ones, confirmed 39.
The Eight That Were Already There
Twenty-one of the 39 sat in one densely connected network built around CD40, CD58, CD5, IL7R, TNFRSF1A and STAT3, and the genes encoding the set were expressed most strongly in B cell subsets. Twenty-eight had also been measured directly in UK Biobank participants later diagnosed with MS: 124 of those, against 52,515 who were not, with blood drawn a median of 5.9 years before diagnosis. Eight were associated with the time to diagnosis, more than chance allows. Their directions mostly disagreed with the genetic estimates, which the authors read as the gap between a lifelong exposure and a measurement taken while the disease is already under way. One protein, DKKL1, agreed in both, and higher predicted levels of it also went with lower disability in a severity study of 12,584 patients. Adding the protein data shrank the candidate causal variants at the shared loci twelvefold. The team lists European ancestry throughout and pleiotropy that cannot be fully ruled out.
Glucose Measured Twice in the Same Patients
Hauck and colleagues went to the lumbar puncture that patients receive at diagnosis anyway. They took the routine records of 88 people diagnosed at the university hospital in Frankfurt between December 2017 and July 2024, none yet treated, excluding anyone with diabetes or another disorder of glucose handling. Mean age was 34.6 years, 79.5% were women and 92.1% had relapsing disease, at a mean disability score of 2.04. Glucose in the spinal fluid averaged 64.0 mg/dl against 104.4 in serum, close to the usual ratio, and every sample was drawn before any steroid. Disability, processing speed, depressive symptoms and fatigue were scored within three months of the puncture. Each outcome was regressed on the spinal fluid value and then on the serum value, adjusted for age, sex, body mass index and the albumin quotient that measures how permeable the barrier between blood and spinal fluid is.
Where the Serum Said Nothing
The spinal fluid measurement went with three of the four outcomes: disability at a standardised coefficient of 0.260, processing speed at −0.245 and depressive symptoms at 0.279. Fatigue did not move. The serum measurement, taken from the same people at the same hour, went with none of the four, although the two values correlated. Lactate in the spinal fluid, which tracked the spinal fluid glucose closely, was unrelated to every outcome. In the 48 patients with a glycated haemoglobin on record it was normal in all and unrelated to the spinal fluid glucose, so the finding does not rest on undiagnosed diabetes. The authors call the study a pilot. It is retrospective, the samples were not taken fasting because they came from routine care, insulin was never measured, and the threshold was left uncorrected. They note that a higher central glucose could be a consequence of damage, a driver of further damage, or both at once.
Red Cells in Half a Million Records
Yang and colleagues counted. In the UK Biobank, 973 participants with MS had lower red cell counts than the 477,069 without it, 4.42 against 4.52 per litre, with lower haemoglobin, lower haematocrit and a wider spread of cell sizes. Following the 477,069 who were free of the disease for a median of 13.8 years, 1,060 were diagnosed, and a higher red cell count at the start went with a lower risk. A clinical cohort at two hospitals in Zhengzhou then recruited 110 patients with relapsing disease and 103 controls matched for age and sex. The same three measurements were lower in the patients, while the white cell count was not. Within the patients the red cell count fell as disability rose, at a correlation of −0.71, and was lower again after five years of disease. Patients with neuromyelitis optica, myasthenia gravis, inflammatory polyneuropathy or a central nervous system infection did not differ from the controls.
What the Damaged Cells Were Carrying
The cells were then opened. The cytoplasm of red cells from eight patients and four controls differed in 29 proteins, among them TLR9, a receptor for free DNA, which was lower inside the patients' cells. Flow cytometry found the opposite outside: more misshapen cells, more TLR9 on their membranes, and less CD47, the marker that tells the spleen to leave a cell alone. Those cells also broke more readily in dilute salt. Oxidised DNA was raised in the patients' plasma, sat on the membranes of the misshapen cells under electron microscopy, and bound TLR9 directly. Transcripts of mitochondrial housekeeping genes, among them PINK1 and ATG7, were shifted in the same blood. The rest of the argument, that this DNA comes from damaged mitochondria in the brain and that clearing the cells carrying it drives inflammation, was made in a mouse model and reversed there with a mitochondrial antioxidant. The team notes that 110 patients carried the mechanistic work, that treatment subgroups were not analysed, and that a red cell has no nucleus, so the receptor cannot be switched off to test the claim. In all three studies the material was ordinary, a tube of blood or a puncture done for the diagnosis, and in each only part of it held the result.
Disclaimer: This blog post is based on the cited studies and is intended for informational purposes only. It is not intended to provide medical advice. Please consult with a healthcare professional for any health concerns.
References:
Ding, Y., Hamitouche, D., Thebault, S., Kearns, P., Abdelhak, A., & Harroud, A. (2026). Genetic-proteomic integration identifies predictive plasma proteins for multiple sclerosis. Annals of Neurology, 100(2), 268-281. https://doi.org/10.1002/ana.78256
Hauck, L., Franz, C., Koerbel, K., et al., Thanarajah, S. E., & Yalachkov, Y. (2026). Cerebrospinal fluid glucose levels and their association with disability, depression, and cognitive function in multiple sclerosis. Metabolic Brain Disease, 41(1), 82. https://doi.org/10.1007/s11011-026-01846-4
Yang, L., Hao, Q., Chen, Y., et al., Li, Y., & Jia, Y. (2026). Altered erythrocyte function via TLR9-ox-mtDNA binding links mitochondrial oxidative damage to systemic inflammation in multiple sclerosis. Neurotherapeutics, 23(2), e00863. https://doi.org/10.1016/j.neurot.2026.e00863
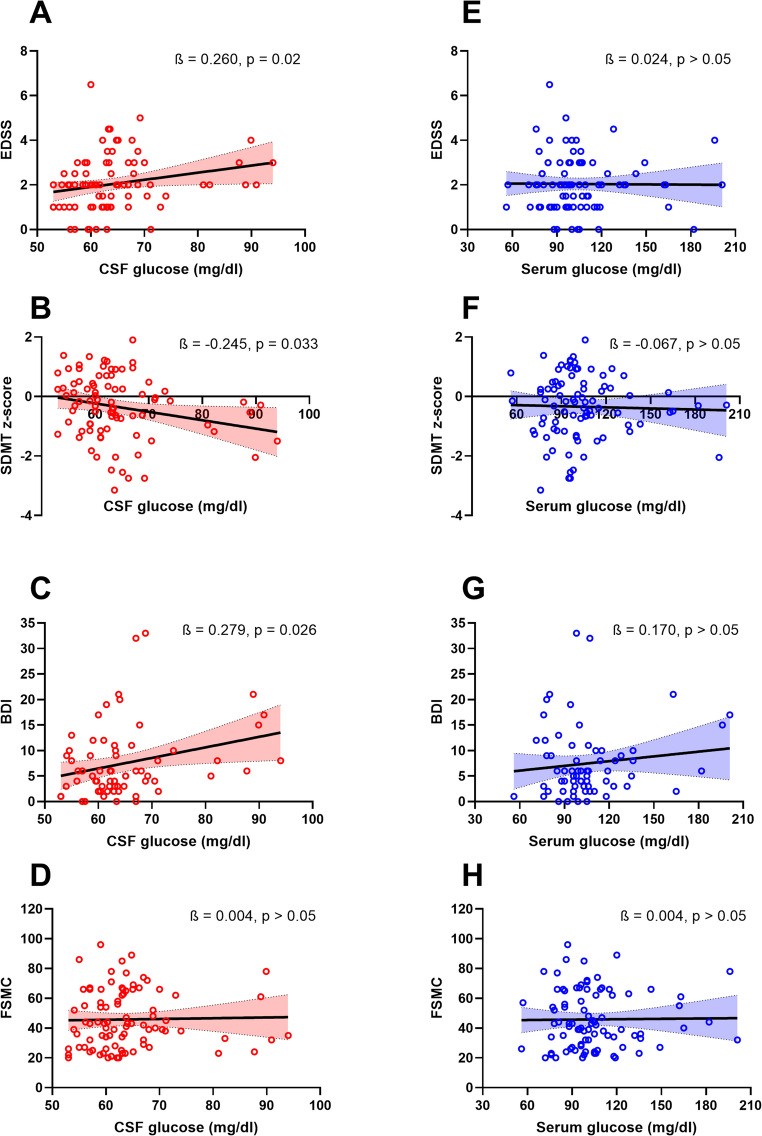
Four clinical outcomes plotted against the glucose concentration measured in spinal fluid (left column) and against the glucose measured in serum in the same patients (right column), with the standardised coefficient from each regression. The three associations in the left column are absent from the right one. (Hauck, et. al. (2026), Metabolic Brain Disease 41(1), 82, Figure 1, CC BY 4.0)