

What MS Transcriptomes Say About Metabolism
Metabolism in multiple sclerosis (MS) is now reported most often as a property of a cell type, and that property is usually inferred from what the cell transcribes. A set of oxidative phosphorylation genes moves together, a glycolytic gene rises in one cluster, and the cell is described as having shifted its metabolism. Three 2026 papers read metabolism from three different starting materials: sorted blood populations sequenced at scale, spinal fluid cells sequenced one at a time, and a single enzyme measured as protein. The three broadly agree on which pathways are involved. They differ on how much signal a transcript can carry, and the sharpest result in the set comes from a measurement that is not a transcript at all.
Six Cell States From One Blood Draw
Roostaei and colleagues built the largest of the three datasets: 1,075 transcriptomes from 209 participants of European ancestry, 167 of them with relapsing-remitting MS and 42 healthy. From each cryopreserved blood sample three populations were sorted, naive and memory CD4 helper T cells and classical CD14 monocytes, and each was split, half sequenced directly and half after stimulation, giving six cell-type-states per person. Patients were early in disease, with disability scores of 0 to 3 and a median duration of 6.8 years, untreated or on one first-line therapy. Across all six states, 704 genes were differentially expressed in MS. Almost none of them appeared in the stimulated conditions, where the transcriptional difference between patients and controls largely vanished. Of more than 200 genes altered in naive T cells and more than 400 in monocytes, only 23 were shared, and two of those, ZBTB16 and HMGB2, moved in all three primary cell types.
A Pathway That Shows Only as a Module
Gene-by-gene testing was then set beside co-expression network analysis, which grouped the data into 197 modules and found six associated with MS after correction. The two strongest both sat in unstimulated T cells, a 54-gene module hubbed on TNFSF8 in naive cells and a 30-gene module hubbed on FKBP5 in memory cells, sharing 11 genes between them. Two further modules carried oxidative phosphorylation, and the authors are explicit that those genes were not significantly enriched among the differentially expressed genes: the coordinated subthreshold change was only visible once genes were tested as a group. Mapped onto a curated mitochondrial resource, the top affected component was respiratory chain complex I in naive T cells and complex IV in stimulated monocytes. The monocyte module normally falls on stimulation, and in MS samples that fall was weaker, so the metabolic reading here is about a blunted response rather than a fixed level.
Where the Genetics Entered
Polygenic scores for MS, taken whole and split into HLA and non-HLA parts, were associated with none of the six modules. A different genetic test worked: 588 genes linked to 233 genome-wide significant loci were enriched in the naive T cell TNFSF8 module. Severity measures gave nothing: no module was associated with disability score, brain parenchymal fraction, lesion burden, or four-year change in any of them, in a cohort the authors note was not built for that question. The functional test was narrower and positive: lower expression of the TNFSF8 module before stimulation went with faster CD4 T cell division afterwards. A compound screen run against the six modules returned glucocorticoid receptor agonists for the two T cell modules and proteasome inhibitors for the monocyte one, with alvespimycin carried forward into bench testing.
The Same Question in Spinal Fluid
Börsch and colleagues went to the compartment next to the lesion. Ten years of routine flow cytometry gave 74 non-inflammatory controls, 169 relapsing-remitting and 56 progressive patients, and in that set the monocyte fraction of spinal fluid was higher in progressive MS, rose with disability score, and fell with radiological and clinical activity, all of which survived adjustment for age and sex. New single-cell sequencing covered 11 controls, 12 relapsing-remitting and 12 progressive patients, 71,459 cells and 23 clusters. Three were monocytic, two of them resembling border-associated macrophages by C1QB, APOE, LYVE1 and TREM2, and those were the cells that expanded in progressive disease. Comparing the two courses gave 533 genes raised in progressive cells against 209 in relapsing-remitting ones. The progressive profile combined antigen presentation with a mixed metabolic signature spanning glycolysis (TPI1, GPI, TKT), oxidative phosphorylation and cholesterol synthesis (FDFT1, CYP51A1), while relapsing-remitting cells carried immediate-early genes alongside GPX1, NAMPT and ACSL1.
The Protein They Measured Instead
That metabolic signature named pathways but separated nobody, so the authors moved to an assay. Soluble TREM2 was measured in spinal fluid supernatant from 25 controls, 24 relapsing-remitting and 37 progressive patients, with 18 Alzheimer's disease samples as a comparison. It was higher in MS than in either control group and rose across the MS continuum. Splitting progressive disease was informative: against relapsing-remitting patients, secondary progressive samples showed more border-associated macrophage-like cells and classical monocytes and fewer B cells, while primary progressive samples showed no notable shift. Because the progressive group was 20 years older on average, age was tested directly, and neither cell abundance nor TREM2 expression tracked age in controls, with the protein result holding in age-adjusted and age-matched subsets. The authors also note an earlier study that found blood soluble TREM2 uninformative in primary progressive disease, which they read as a compartment difference.
An Enzyme Whose Level Says Nothing
Ellmeier and colleagues measured one protein in three separate cohorts. PKM2 is a glycolytic enzyme with a second job outside glycolysis, and the second job depends on whether it sits as a monomer or a tetramer. In 26 healthy donors and 35 patients, memory and effector T cells carried more PKM2 than naive cells, and CD4 more than CD8, but patients and controls did not differ in any subset. A second cohort of 25 and 25 added that Th17 and Tc17 cells hold the most and regulatory T cells the least, and again found no gap. The gap appeared only in the third cohort, 16 healthy donors and 14 patients, where cross-linking showed MS blood cells carrying PKM2 almost entirely as monomer while controls retained tetramer. An allosteric activator that forces tetramer formation cut interferon gamma, interleukin 17F, interleukin 5 and interleukin 13 more in patient cells than control cells, with no measurable change in glycolytic or respiratory rate, pointing the effect away from the enzyme's first job. Both sequencing studies named metabolic pathways without separating one group from another, and in both of the papers that did separate groups, the separating measurement was a protein.
Disclaimer: This blog post is based on the cited studies and is intended for informational purposes only. It is not intended to provide medical advice. Please consult with a healthcare professional for any health concerns.
References:
Roostaei, T., Fujita, M., Touil, H., et al., Klein, H.-U., & De Jager, P. L. (2026). Cell-type- and state-resolved transcriptomics uncovers distinct T cell and monocyte dysregulation in multiple sclerosis. Cell Reports, 45(6), 117417. https://doi.org/10.1016/j.celrep.2026.117417
Börsch, A. L., Riethues, F., et al., Bernard-Valnet, R., & Meyer zu Hörste, G. (2026). A CSF disease-associated macrophage signature defines progressive multiple sclerosis. Journal of Neuroinflammation, 23(1), 156. https://doi.org/10.1186/s12974-026-03861-9
Ellmeier, E., Schnabl, A., et al., Khalil, M., & Angiari, S. (2026). Targeting pyruvate kinase M2 (PKM2) reduces T cell pathogenicity in multiple sclerosis. EBioMedicine, 128, 106314. https://doi.org/10.1016/j.ebiom.2026.106314
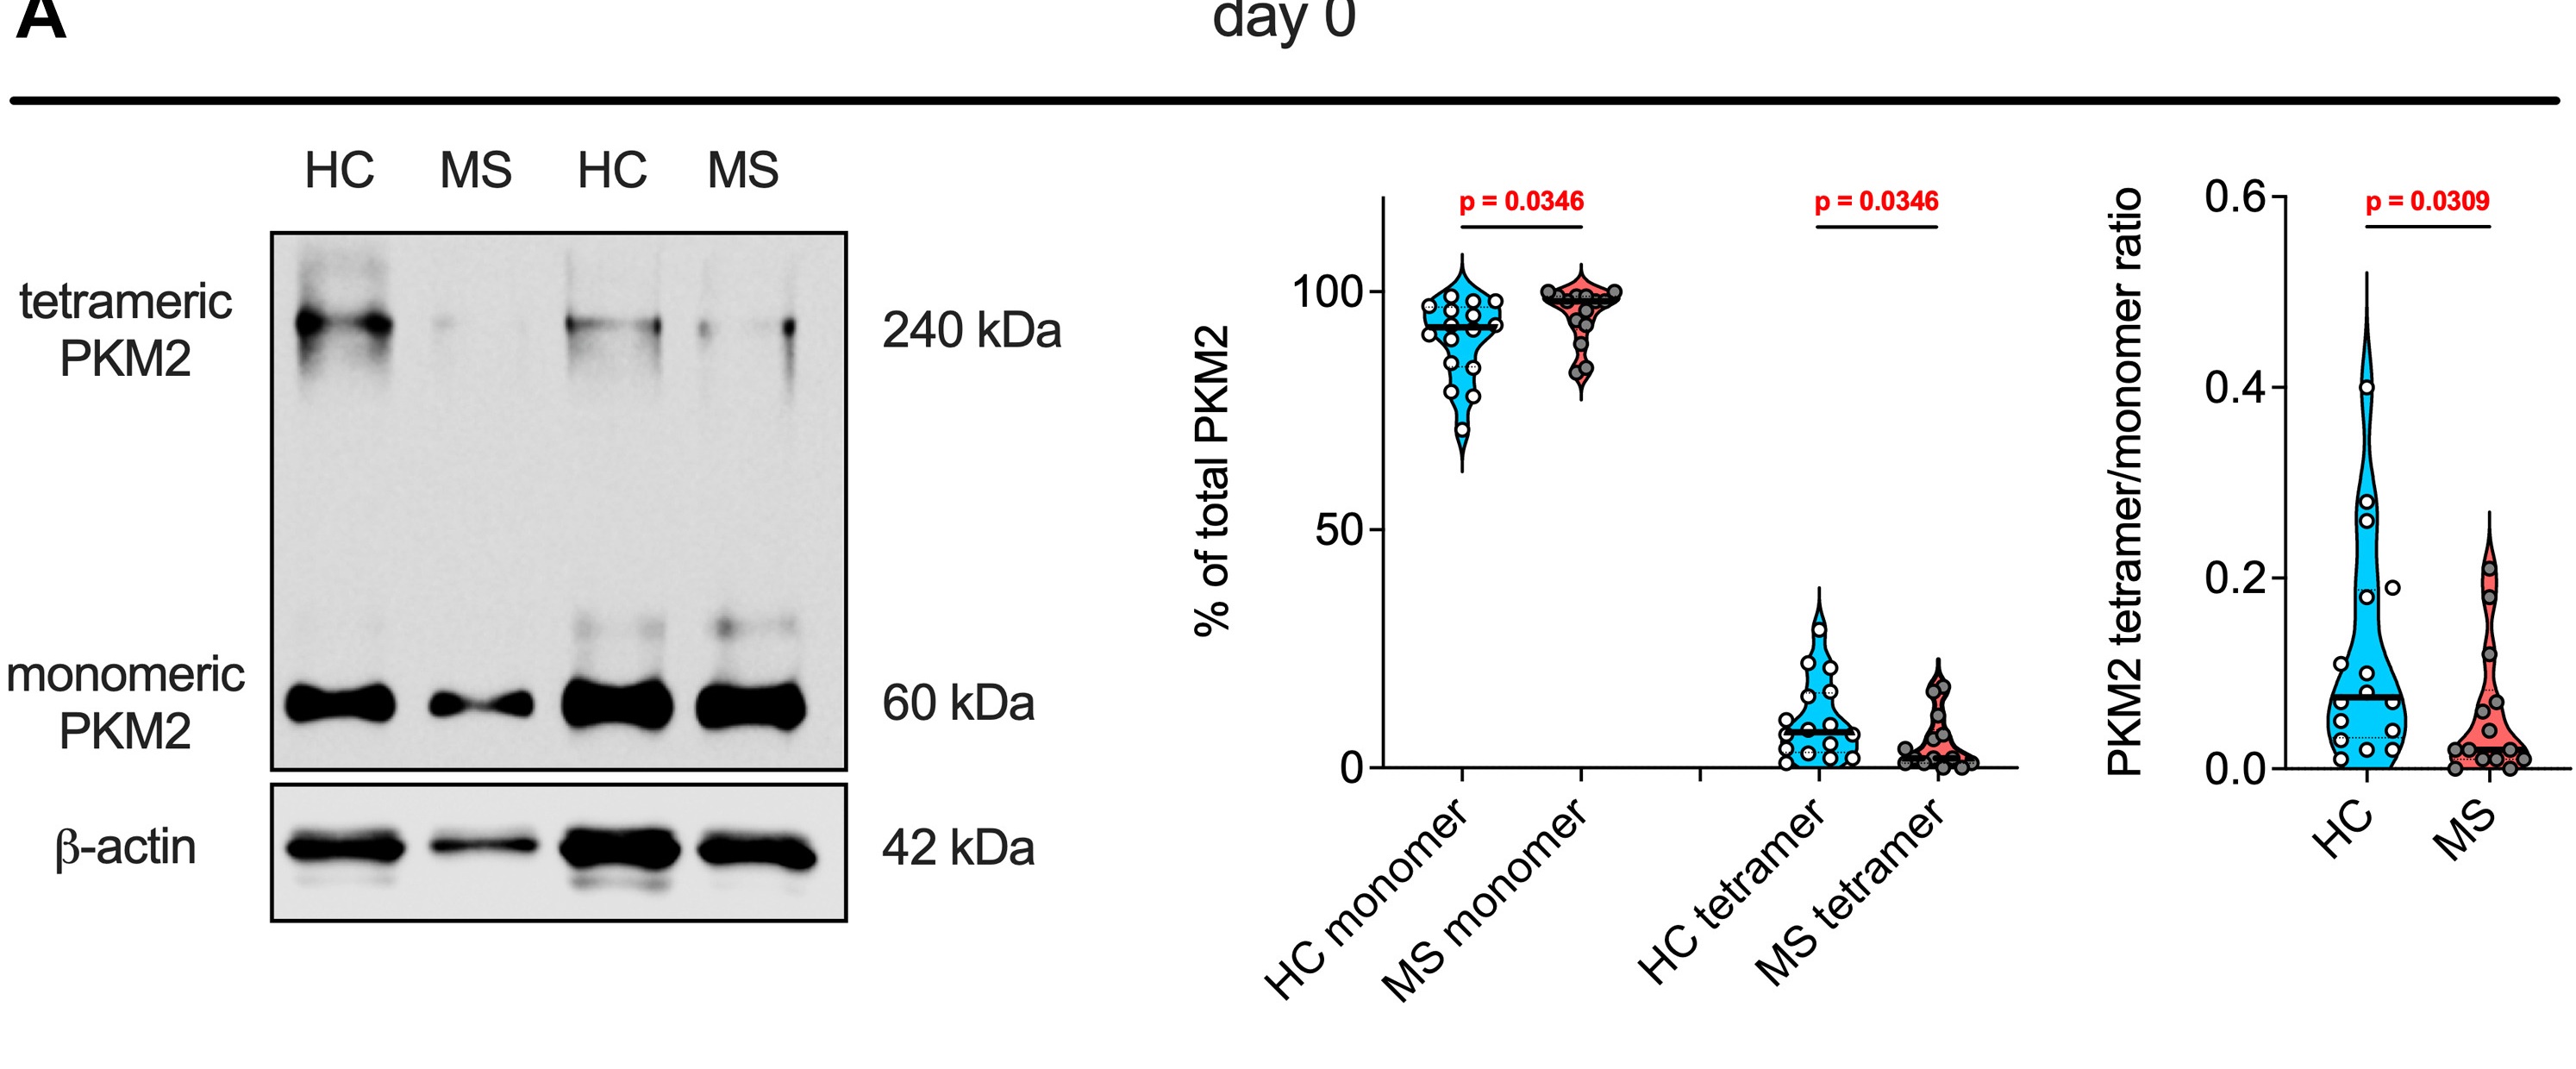
The same amount of enzyme, a different form of it. Cross-linking separates tetrameric from monomeric PKM2 in resting blood cells of 16 healthy donors and 14 patients. (Ellmeier, et. al. (2026), EBioMedicine 128, 106314, Figure 7A, CC BY 4.0)