

Three Things Tested Against the Course of MS
Three studies of multiple sclerosis (MS) published this year test something against the course the disease takes, and the three things they test sit at very different distances from the person. One is an inherited background fixed before birth. One is a second diagnosis that arrives decades later. One is a capsule taken twice a day for ninety days. The outcomes they can reach differ just as much, running from disability and cognition through hospital admissions and death to a single protein in blood. Read together they say something plain about where the course of MS is currently reachable, and each team states which outcome its design could actually measure.
Family History in Three Thousand Swedish Cases
Hedström and colleagues drew on the Swedish epidemiologic investigation of multiple sclerosis, which recruited incident cases from 40 neurology units between 2005 and 2021 with a 91% participation rate. After excluding those unsure whether MS ran in the family and those without follow-up disability scores, 3,094 people remained: 239 (7.7%) with an affected first-degree relative, 468 (15.1%) with a second or third-degree relative, and 2,387 with none. The groups matched at baseline on age at onset, sex, phenotype, disability, body mass index, smoking and treatment, with one exception. HLA-DRB1*15:01, the strongest single risk allele in MS, was carried by 68.3% of those with an affected first-degree relative against 52.8% and 53.4% in the other two groups (p = 0.005). Outcomes came from the national MS registry: confirmed disability worsening, the disability milestones 3 and 4, a drop of eight points or more in processing speed, new or enlarging lesions on routine imaging, and a worsening of patient-reported impact.
Every Outcome Returned One
Adjusted for age, sex, ancestry, education, year of diagnosis, disease duration, baseline disability, smoking, body mass index and initial therapy, the hazard ratio for confirmed worsening was 1.06 (0.89 to 1.30) for first-degree familial MS and 1.04 (0.90 to 1.20) for the more distant group. Splitting that outcome by mechanism gave 1.05 for relapse-associated worsening and 1.10 for relapse-independent progression. The milestones gave 1.16 and 0.97, new lesions 1.11 (0.92 to 1.35), cognitive worsening 1.05 (0.79 to 1.41), and the two patient-reported scales 1.01 and 1.06. Modelling therapy as time-varying, folding the uncertain group into the non-familial one, and separating second from third-degree relatives all left this unchanged. The authors note that family history is self-reported, that 239 first-degree cases limit the power to find small effects, and that a reported family history is a crude stand-in for inherited risk, since it captures neither the burden nor the composition of a person's risk variants.
Half a Million English Records
Lau and colleagues moved to something acquired. Using English primary care records linked to hospital episodes and death registrations, they matched 47,247 adults with MS to 458,951 people without it on general practice, sex and year of birth, excluded anyone with diabetes recorded before the index date, and allowed a six-month gap after diagnosis so that the diagnostic process itself would not count. Mean age was 43.8 years and mean follow-up 15.2 years. Over that time 2,119 people with MS (4.48%) and 21,720 controls (4.73%) acquired a diabetes diagnosis, at crude rates of 3.14 and 3.00 per 1,000 person-years. Adjusted for age, sex, ethnicity, deprivation, rural or urban practice and smoking, the incidence rate ratio was 1.16 (1.11 to 1.21), unmoved by adding baseline hypertension and reproduced in a survival model. Diabetes type was unrecorded in 64% of the incident cases.
Admissions and Deaths, Not Disability
Among people with MS, the new diagnosis went with half again as many hospital admissions (adjusted rate ratio 1.52, 1.42 to 1.64) and a median of 12 days in hospital against 2 days for those who stayed free of it. Modelled as a time-varying exposure, it carried a 41% higher hazard of death (1.31 to 1.49), rising to 1.69 when only confirmed diabetes counted. Both associations were larger in the matched controls, at 2.36 for admissions and 1.69 for mortality, and the mortality association did not differ significantly between the two cohorts. Inside the MS group the admission association was stronger at rural practices, while neither deprivation nor ethnicity modified it. What these numbers reach is all-cause hospital use and death, not disability or progression. The team lists the limits of routinely collected data, the chance that frequent clinic contact detects diabetes earlier in MS, residual confounding by baseline health, and an index date that is a first recorded code rather than true onset.
Five Hundred Milligrams Twice a Day
Moser and colleagues took the shortest distance of the three. Propionic acid is a short-chain fatty acid produced when gut bacteria ferment dietary fibre; it crosses into the circulation and the brain, and it runs low in the stool and blood of people with MS. Their single-centre trial in Salzburg invited 578 people from a local registry and randomised 101 clinically stable adults, two to one, to sodium propionate 500 mg twice daily or matching placebo for 90 days, with 96 completing. The cohort was 64% women at a mean age of 45, 78% relapsing-remitting, with 61% on moderate-to-high efficacy therapy and 40% on anti-CD20 treatment, and no therapy changed during the trial. The primary outcome was serum neurofilament light chain, a marker of neuroaxonal damage, adjusted for age, body mass index, creatinine and its own baseline value, with the trial powered to detect a difference of 1.36 pg/ml.
Eighteen Percent in Ninety Days
In the propionate arm the marker fell from 9.77 to 8.02 pg/ml, a drop of 17.9% (p = 0.000025), while the placebo arm moved from 9.90 to 8.92 and did not reach significance. The adjusted difference between arms at 90 days was 0.91 pg/ml (0.02 to 1.79, p = 0.045). Restricted to the 84 participants whose treatment had not changed in the preceding year, the fall was 15.2% and the gap between arms widened to 1.48 pg/ml. The marker also fell within the 41 participants on higher-efficacy therapy and the 27 on anti-CD20, though not against placebo. No secondary outcome separated the arms. Motor fatigue improved inside the propionate arm, from 31.2 to 29.3, without correction for multiple testing; processing speed rose and dexterity fell in both arms, which the team reads as practice and summer heat. Bloating was reported by 13% on propionate and nobody on placebo. They list the single centre, the ninety days, no measurement of propionate in participants' own blood, and a marker that is not specific to one disease. The thing that could be altered is the one that moved a number, and that number was the one closest to the blood.
Disclaimer: This blog post is based on the cited studies and is intended for informational purposes only. It is not intended to provide medical advice. Please consult with a healthcare professional for any health concerns.
References:
Hedström, A. K., Olsson, T., & Alfredsson, L. (2026). Family history of multiple sclerosis and long-term outcomes. Journal of Neurology, 273, 622. https://doi.org/10.1007/s00415-026-14162-9
Lau, Y., Zabihi, S., Hartmann, M., et al., Cooper, C., & Dobson, R. (2026). Incident comorbid diabetes and outcomes in multiple sclerosis: an English population-based cohort study. Annals of Clinical and Translational Neurology, advance online publication. https://doi.org/10.1002/acn3.70548
Moser, T., Hitzl, W., Lerda-Casaccia, T., et al., Trinka, E., & Wipfler, P. (2026). Propionic acid in multiple sclerosis: a phase 2b, double-blind, randomized placebo-controlled trial. Brain, 149(7), 2286-2294. https://doi.org/10.1093/brain/awag099
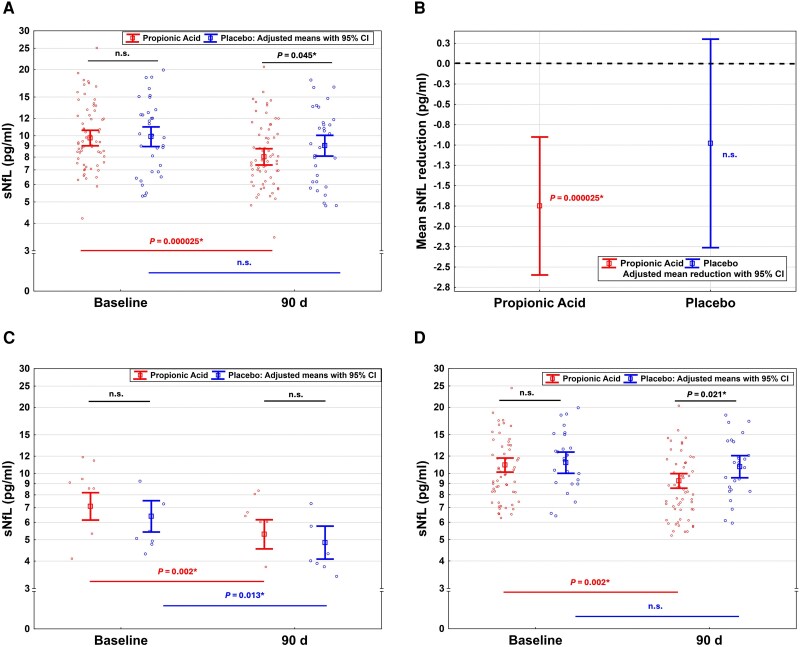
Serum neurofilament light chain at baseline and after ninety days, for the whole trial in the upper panels and split by whether treatment had changed in the preceding year in the lower ones. The propionate arm is red and the placebo arm blue, with adjusted means and 95% intervals over the individual values. (Moser, et. al. (2026), Brain 149(7), 2286-2294, Figure 2, CC BY 4.0)